
Release Notes
See what's new added, changed, fixed, improved or updated.
Smarter Data Exploration with Multi-Agent AI
Introducing Grafieks Ontology, a powerful way to connect business concepts, data sources, and relationships into a unified business model. Build a business-aware foundation that makes data easier to understand, explore, and analyze.
Key capabilities include:
- Entity-Based Business Modeling: Define important business entities such as Customers, Products, Orders, Employees, and Accounts based on your business domain.
- Flexible Semantic Layer Integration: Assign the appropriate semantic-layer data source to each business entity, allowing multiple semantic layers to work together.
- Connected Business Relationships: Establish relationships between entities across departments, systems, and business functions to represent real-world business processes.
- Cross-Domain Data Exploration: Connect information across Sales, Finance, Operations, and other business domains to gain a unified view of your business.
- Business Context for AI: Enable AI to understand business concepts and relationships rather than relying solely on underlying technical data structures.
- Root Cause Analysis: Trace business questions across connected entities, investigate contributing factors, and uncover potential root causes using related data.
- Consistent Business Definitions: Establish a shared business vocabulary that helps teams interpret data consistently and make informed decisions.
- Industry-Agnostic Modeling: Create business ontologies tailored to different industries, departments, and organizational requirements.
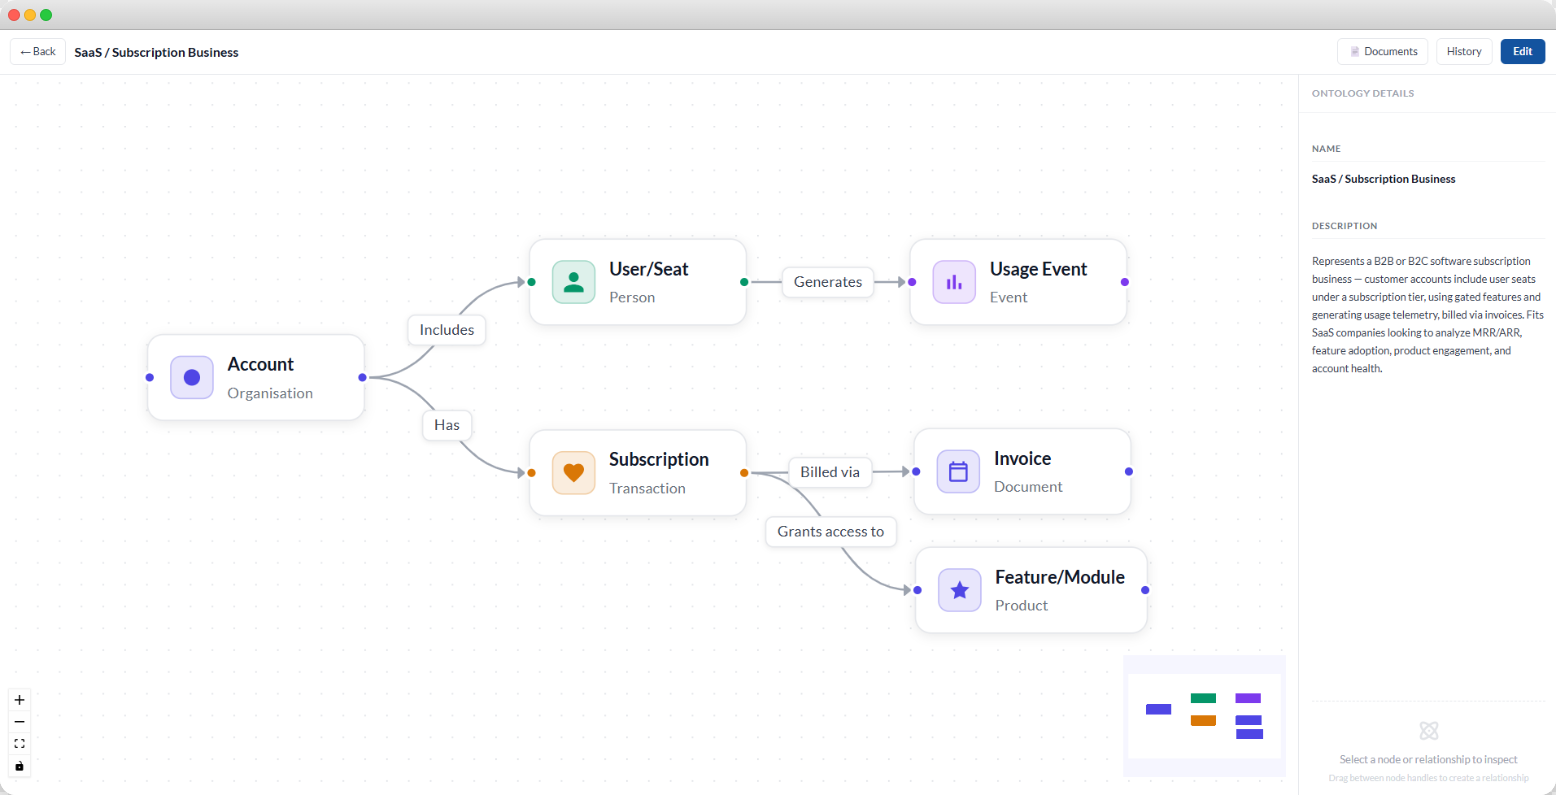
- Connect your business to your data, bring context to your analytics, and empower AI-driven insights with Grafieks Ontology & Semantic Layer.
Smarter Data Exploration with Multi-Agent AI
Introducing an enhanced AI-powered conversational analysis experience that transforms how users interact with and explore their business data. Users can ask questions in natural language and receive meaningful insights through interactive charts, tables, and summaries.
Enhanced capabilities for data analysis and visualization:
- Natural Language Data Exploration: Ask business questions in natural language and receive meaningful insights without writing SQL.
- Multi-Agent Collaboration: Multiple specialized AI agents work together to understand questions, analyze data, and deliver accurate insights.
- Interactive Insights: Explore results through automatically generated charts, tables, and summaries.
- Contextual Follow-up Questions: Continue conversations to investigate trends, compare metrics, and uncover deeper insights.
- Agent Activity Traceability: Track the activities performed by individual AI agents throughout the analysis process.
- Transparent Execution Workflow: Trace each analysis through its execution steps, including planning, SQL generation, SQL execution, and other agent activities.
New navigation menu
We've improved the navigation experience by moving the Easy Access, Notifications, Alerts, and Profile buttons from the header to the vertical navigation bar. This provides a cleaner header layout and makes essential navigation options easier to access in one convenient location.
New AI workflow execution modes in Notebook
We’ve added three workflow execution modes to notebooks, giving you more control over how workflows run:
- Auto — runs the full workflow without pausing.
- Step — pauses after each step for confirmation.
- Intelligent — asks for input only when the agent needs it.
- New AI workflow execution modes in Notebook: Auto, Step, and Intelligent.
Analytics features
We’ve added a new set of Analytics features to help you analyze trends, compare periods, and understand how individual values contribute to your data.
What you can do?
- Compare your current data with values from a previous period directly in the same visualization.
- Track cumulative values across your data with Running Total.
- Understand the contribution of individual values to a total with Percentage of Total.
- Smooth out short-term fluctuations and make underlying trends easier to identify with Moving Average.
- Add a Reference Line to your chart to highlight a specific value or threshold and make it easier to compare your data against a target, benchmark, or baseline.
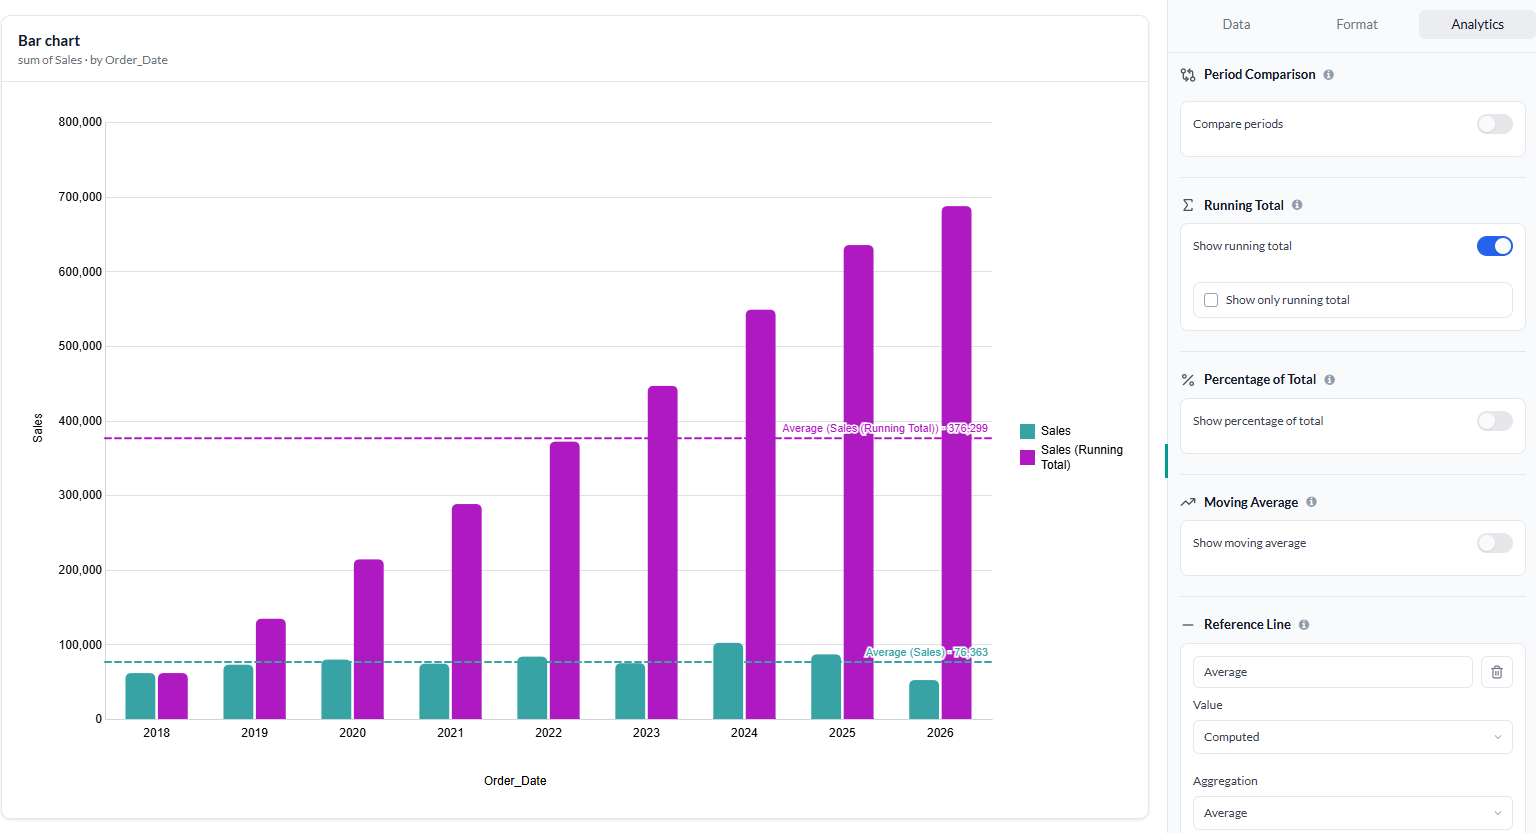
- Analytics features: Compare periods, track cumulative values, understand contributions, smooth out fluctuations, and add reference lines to your charts.
AI-Powered Notebook just got a lot more capable.
Until now, each cell worked the same way: you wrote a prompt, the AI responded, and you moved to the next cell. It was fast, but it was on you to string the steps together — plan the analysis, decide what to run next, and check whether the output actually made sense.
The notebook now works agentically, end to end. Instead of executing one prompt at a time, the AI can:
- Plan — break down your goal into a sequence of steps across cells
- Orchestrate — decide what to run, in what order, and adapt the plan as new information comes in
- Execute — run code, transform data, and produce outputs across the notebook
- Evaluate — check its own results, catch errors or dead ends, and self-correct before moving forward
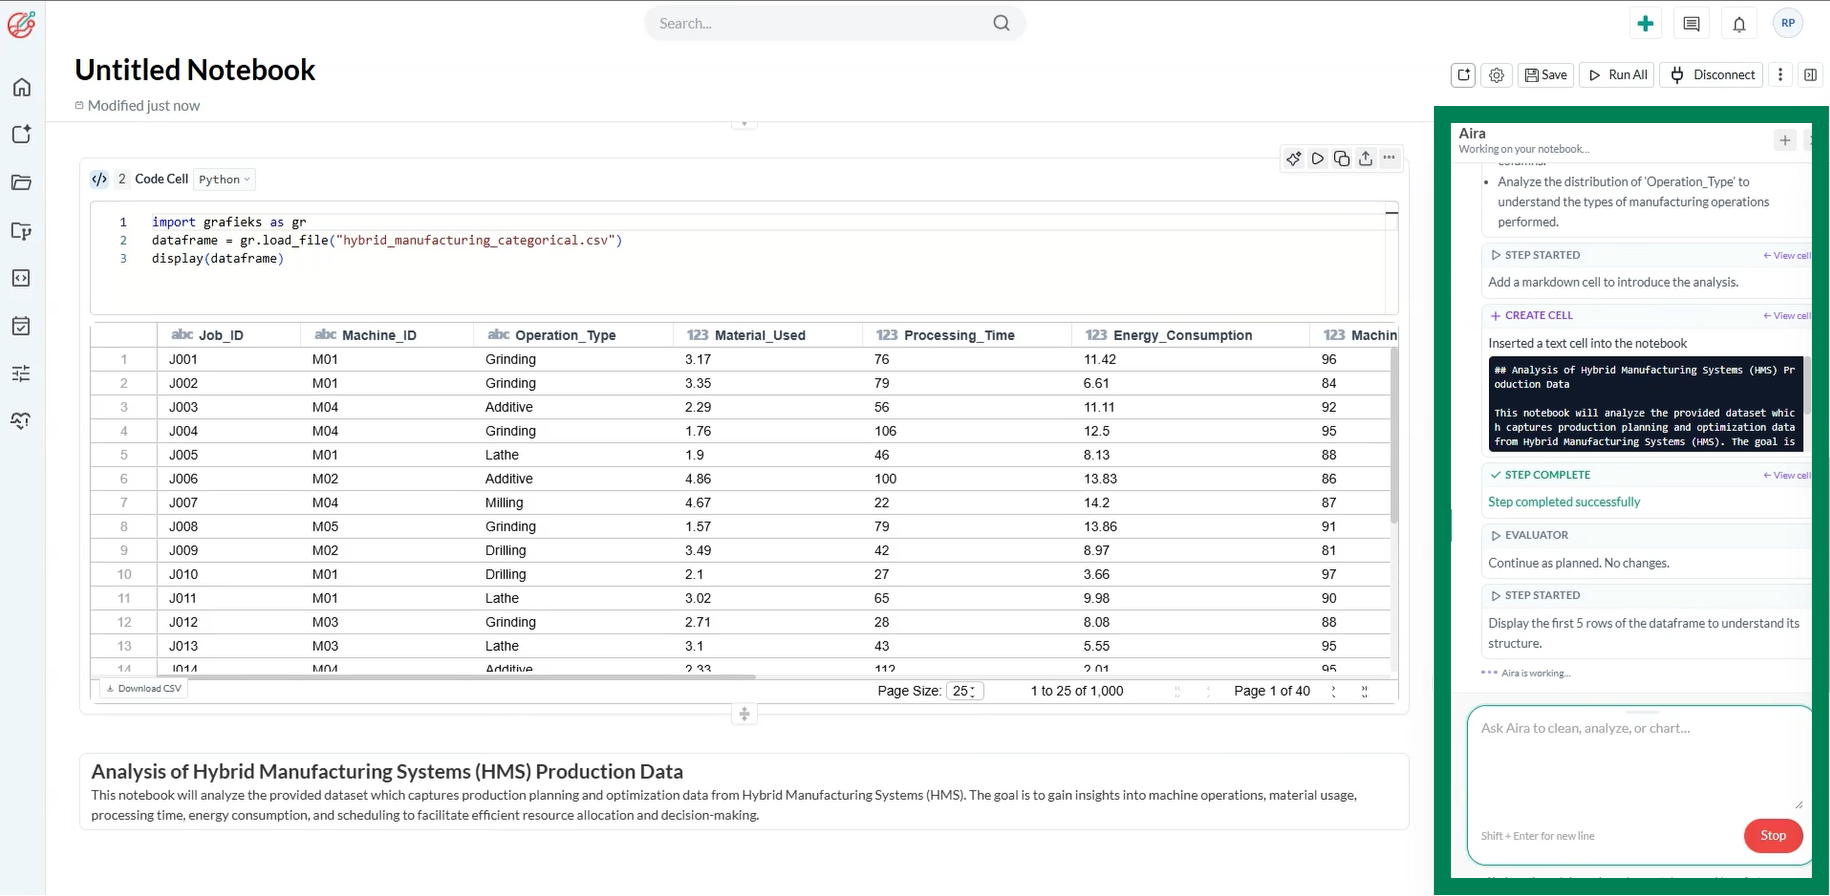
- The notebook now works agentically, end to end. Instead of executing one prompt at a time, the AI can: Plan, Orchestrate, Execute, Evaluate.
Customize chart appearance directly from the Dashboard Designer canvas page
Customization options include:
- Data Labels: Show or hide value labels and customize their number format, position, font, size, style, and color.
- Axes: For axis-based charts, customize X-axis and Y-axis visibility, names, fonts, colors, tick marks, and axis lines.
- Gridlines: Control gridline visibility, style, width, and color.
- Legend: Show or hide the legend and customize its position, font, size, style, and color.
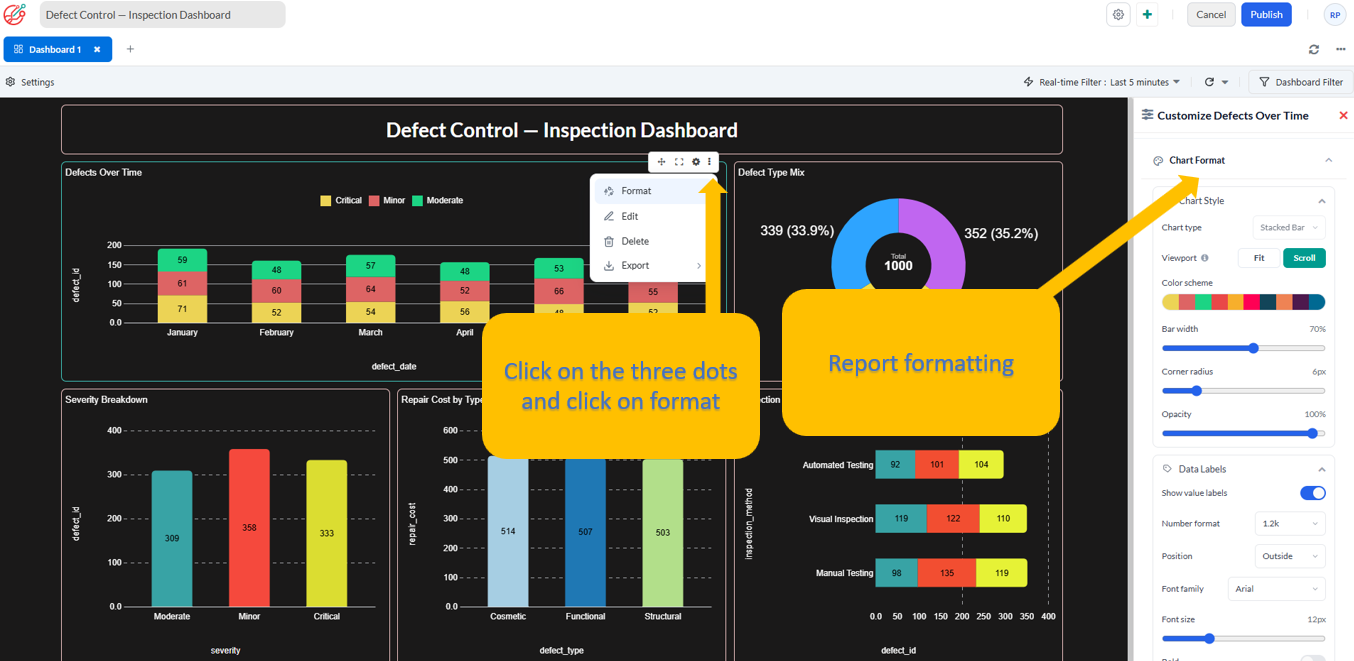
- Customize chart appearance directly from the Dashboard Designer canvas page
Export Dashboards
We’ve added new export options and improved filtering capabilities to make it easier to share, analyze, and work with your data.
You can now export dashboards and reports in the following formats:
- PNG
- JPG
You can now export report data in the following formats:
- CSV
- Excel
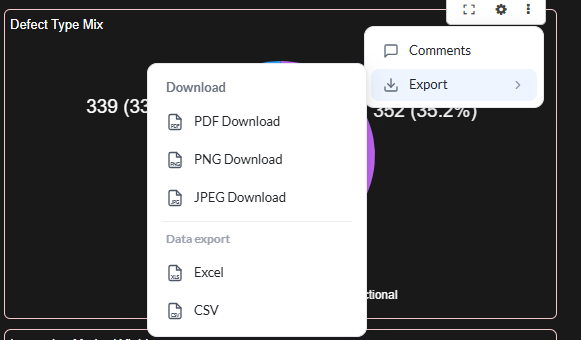
- Export Dashboards and Reports in PDF, PNG and JPG
- Export report data in CSV and Excel
New Funnel Chart Templates
We've introduced Funnel Chart Templates to give you more flexibility in presenting funnel data. You can now choose from multiple built-in funnel styles to best match your reporting and visualization needs.
Available templates include:
- Stepped Bar: Classic segmented funnel with uniform sections.
- Inverted Triangle: Traditional tapered funnel view.
- Pyramid: Upright pyramid-style visualization.
- Gradient Fill: Modern funnel with gradient styling.
- Bar Overlay: Layered horizontal bar presentation.
- Horizontal Bar: Funnel stages displayed horizontally.
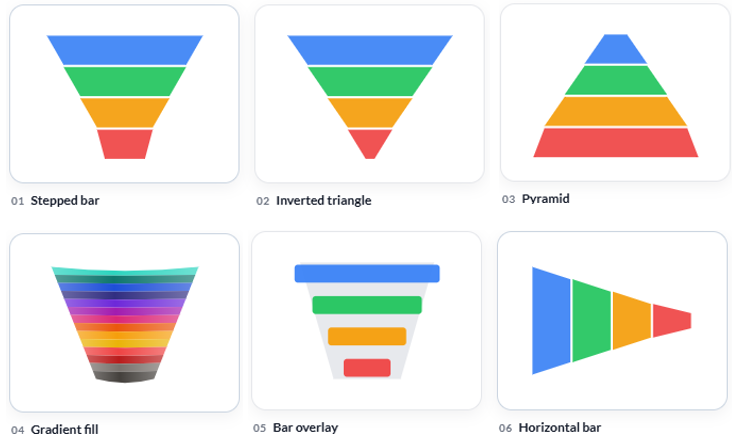
- New Funnel Chart Templates
KPI Templates
We're excited to introduce KPI Templates, a set of pre-built templates for creating and managing key performance indicators.
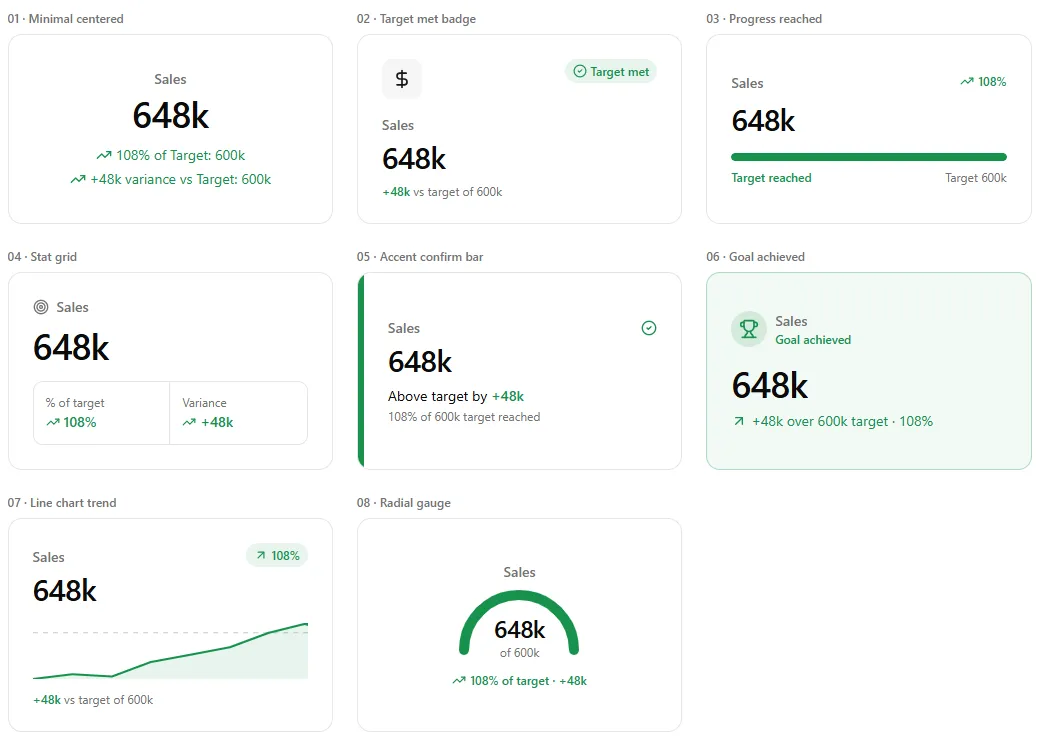
- Create reports faster and more consistently with KPI Templates.
Data Notebook
We're excited to introduce Data Notebook, a unified workspace for preparing, analyzing, and publishing data.
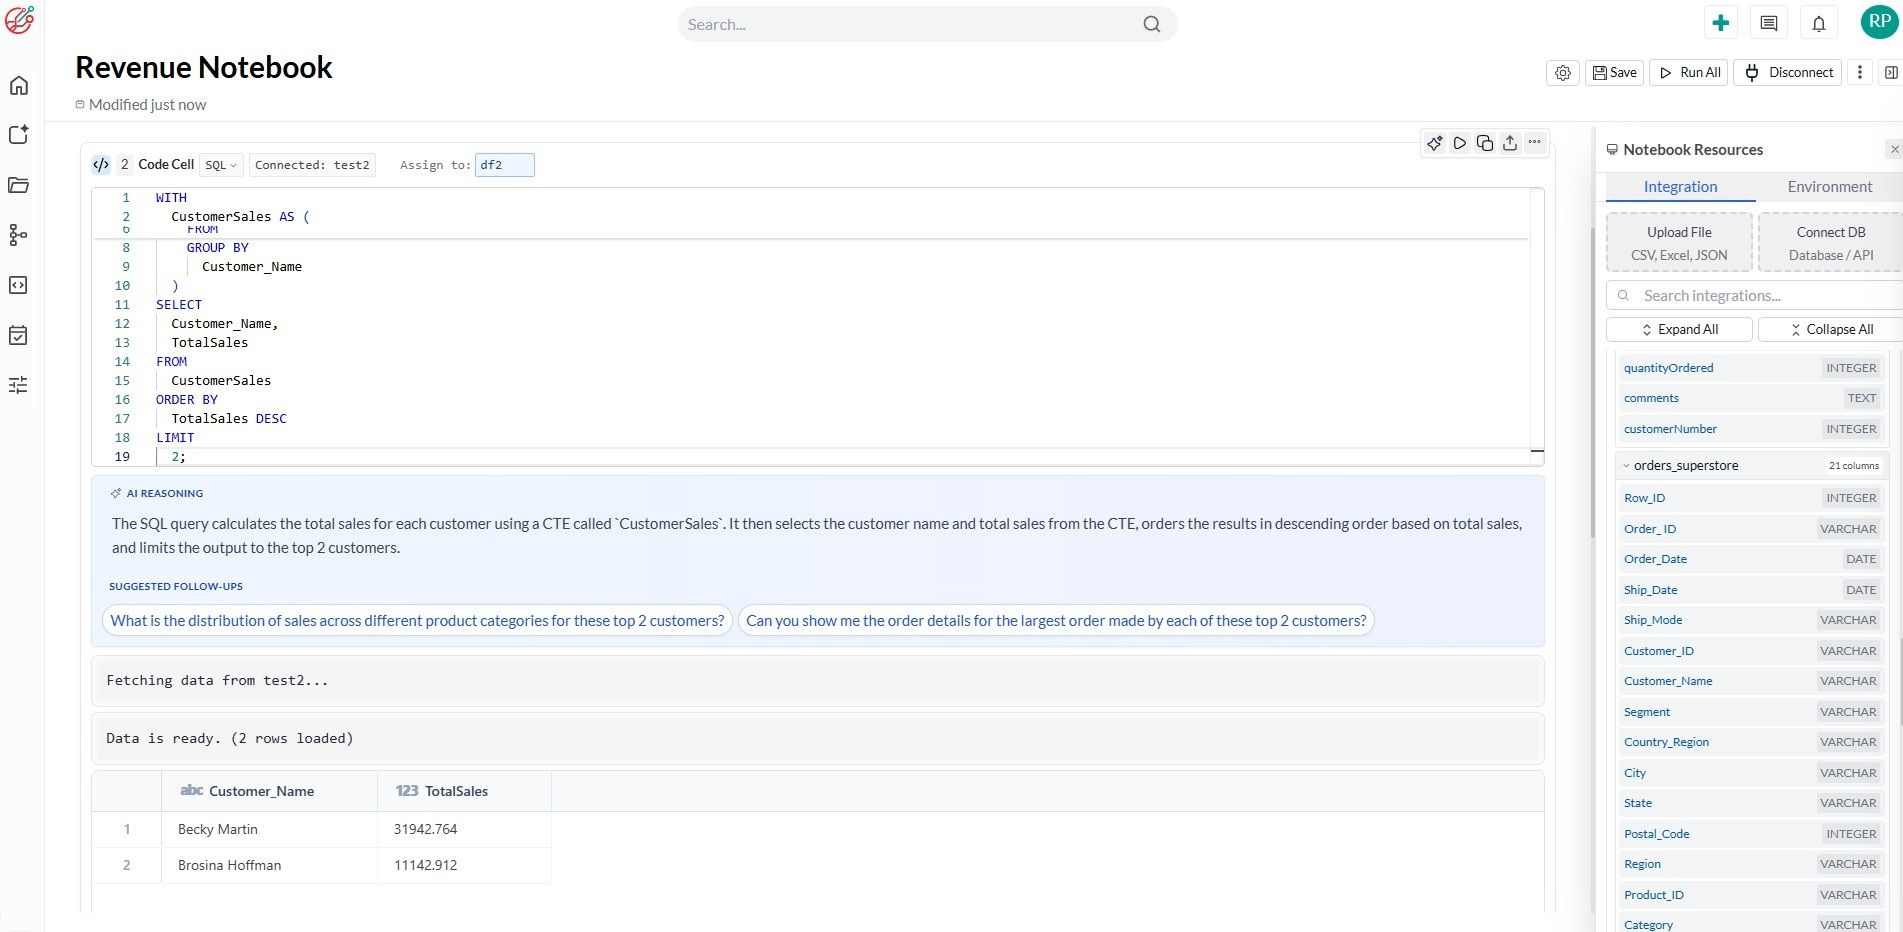
- SQL + Python in one place – Seamlessly switch between SQL queries and Python code within the same notebook.
- AI-powered assistance – Get intelligent suggestions for SQL and Python while maintaining full control—AI never executes code automatically.
- Secure sandbox – Run notebooks in an isolated environment with no external internet access, helping keep your data secure.
- Data preparation – Clean, transform, and preprocess data using SQL or Python before publishing.
- Direct dashboard publishing – Publish prepared datasets directly to dashboards for faster reporting and visualization.
Introducing AI-Powered Conversational Analysis
We’re thrilled to unveil the next evolution of Grafieks: Conversational Analysis - where interacting with your data feels just like having a conversation with an AI data analyst.
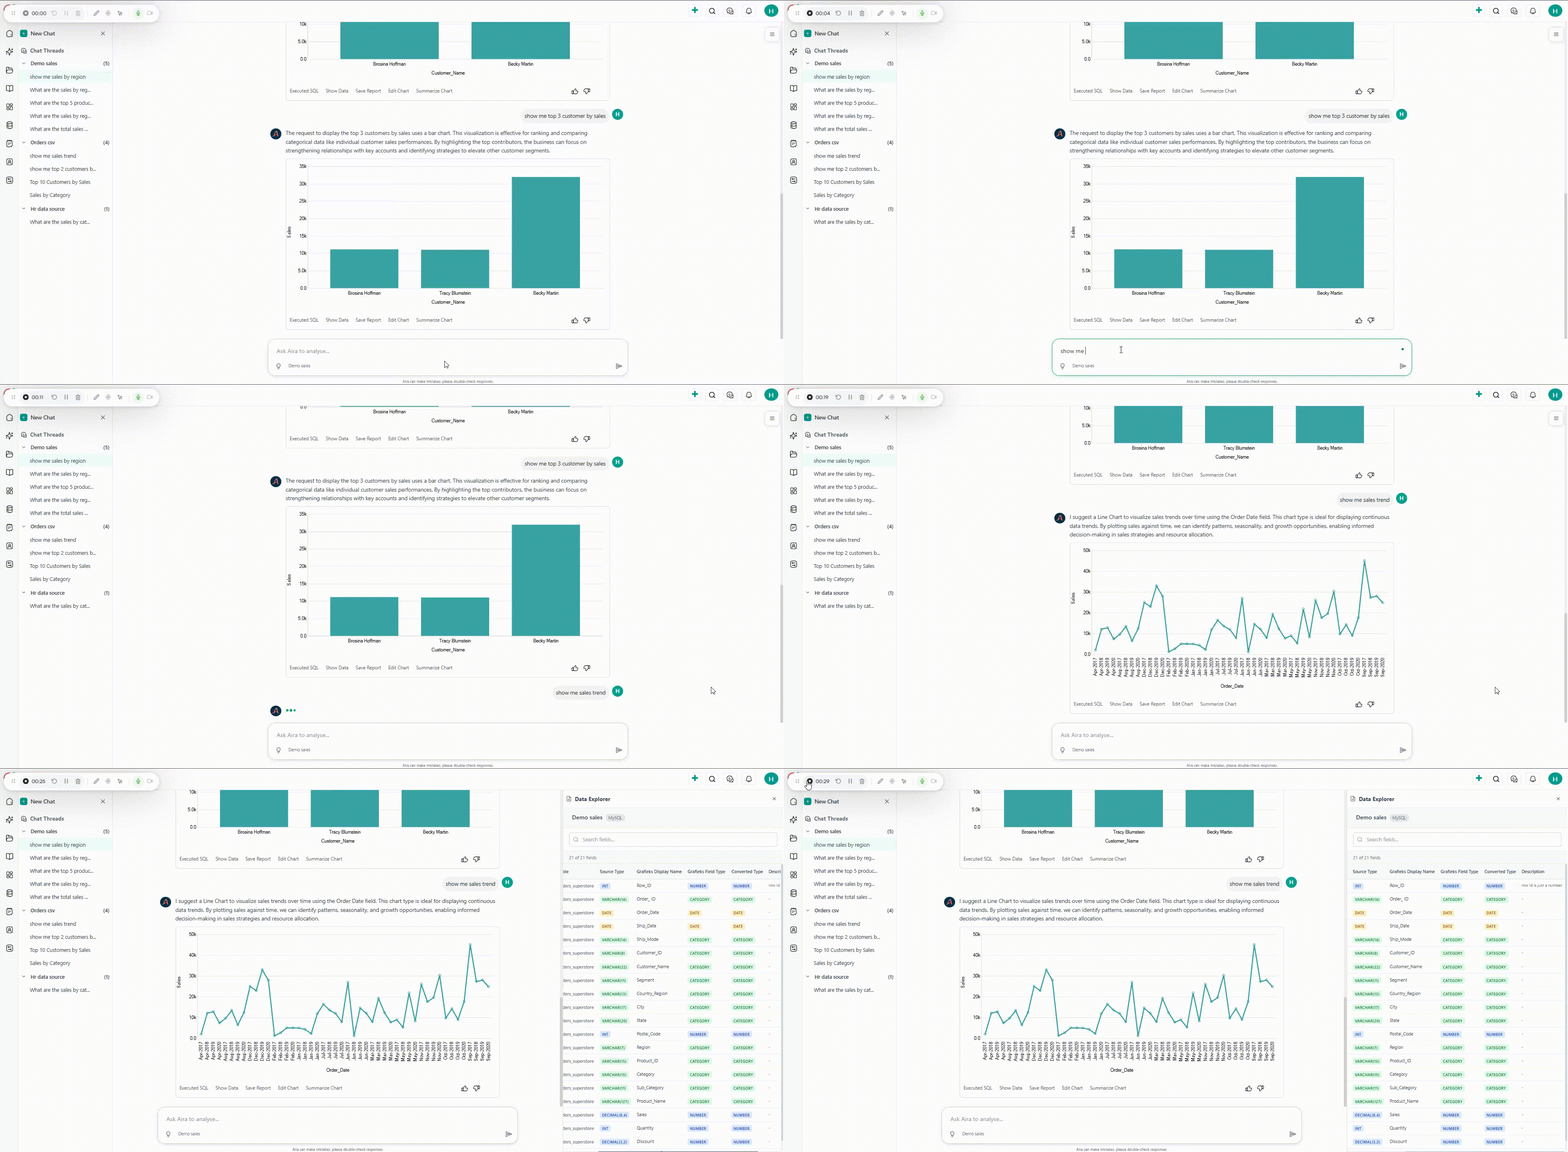
- Interactive Chat Interface: Ask questions, explore trends, and receive actionable insights in real-time through a chat-style conversation.
- Smart Insights & Summaries: The AI does not just respond—it analyzes your data and highlights key findings, patterns, and anomalies automatically.
- Persistent Chat History: Every conversation is saved in a threaded menu, so you can revisit insights anytime.
- SQL Transparency: Behind every insight, the AI generates SQL queries you can view, ensuring transparency and trust in your results.
- Editable & Savable Reports: Transform chat insights into fully editable reports and save them to your dashboard for ongoing analysis.
From Spreadsheet to Insights in Minutes
Spreadsheets are everywhere—but turning them into insights is often harder than it should be. Picture this:
- Customer survey results sitting in Excel
- A CRM export in CSV format
- A delivery report arriving as an email attachment
Traditionally, analyzing these files meant:
- Raising tickets with data engineering
- Setting up one-off ETL jobs
- Wrestling with database access
- Waiting hours (or days) to start exploring
Not anymore.
With Grafieks, you can now upload CSV or Excel files directly into the platform and analyze them instantly with our in-memory processing engine. And with AI, finding insights is faster than ever.
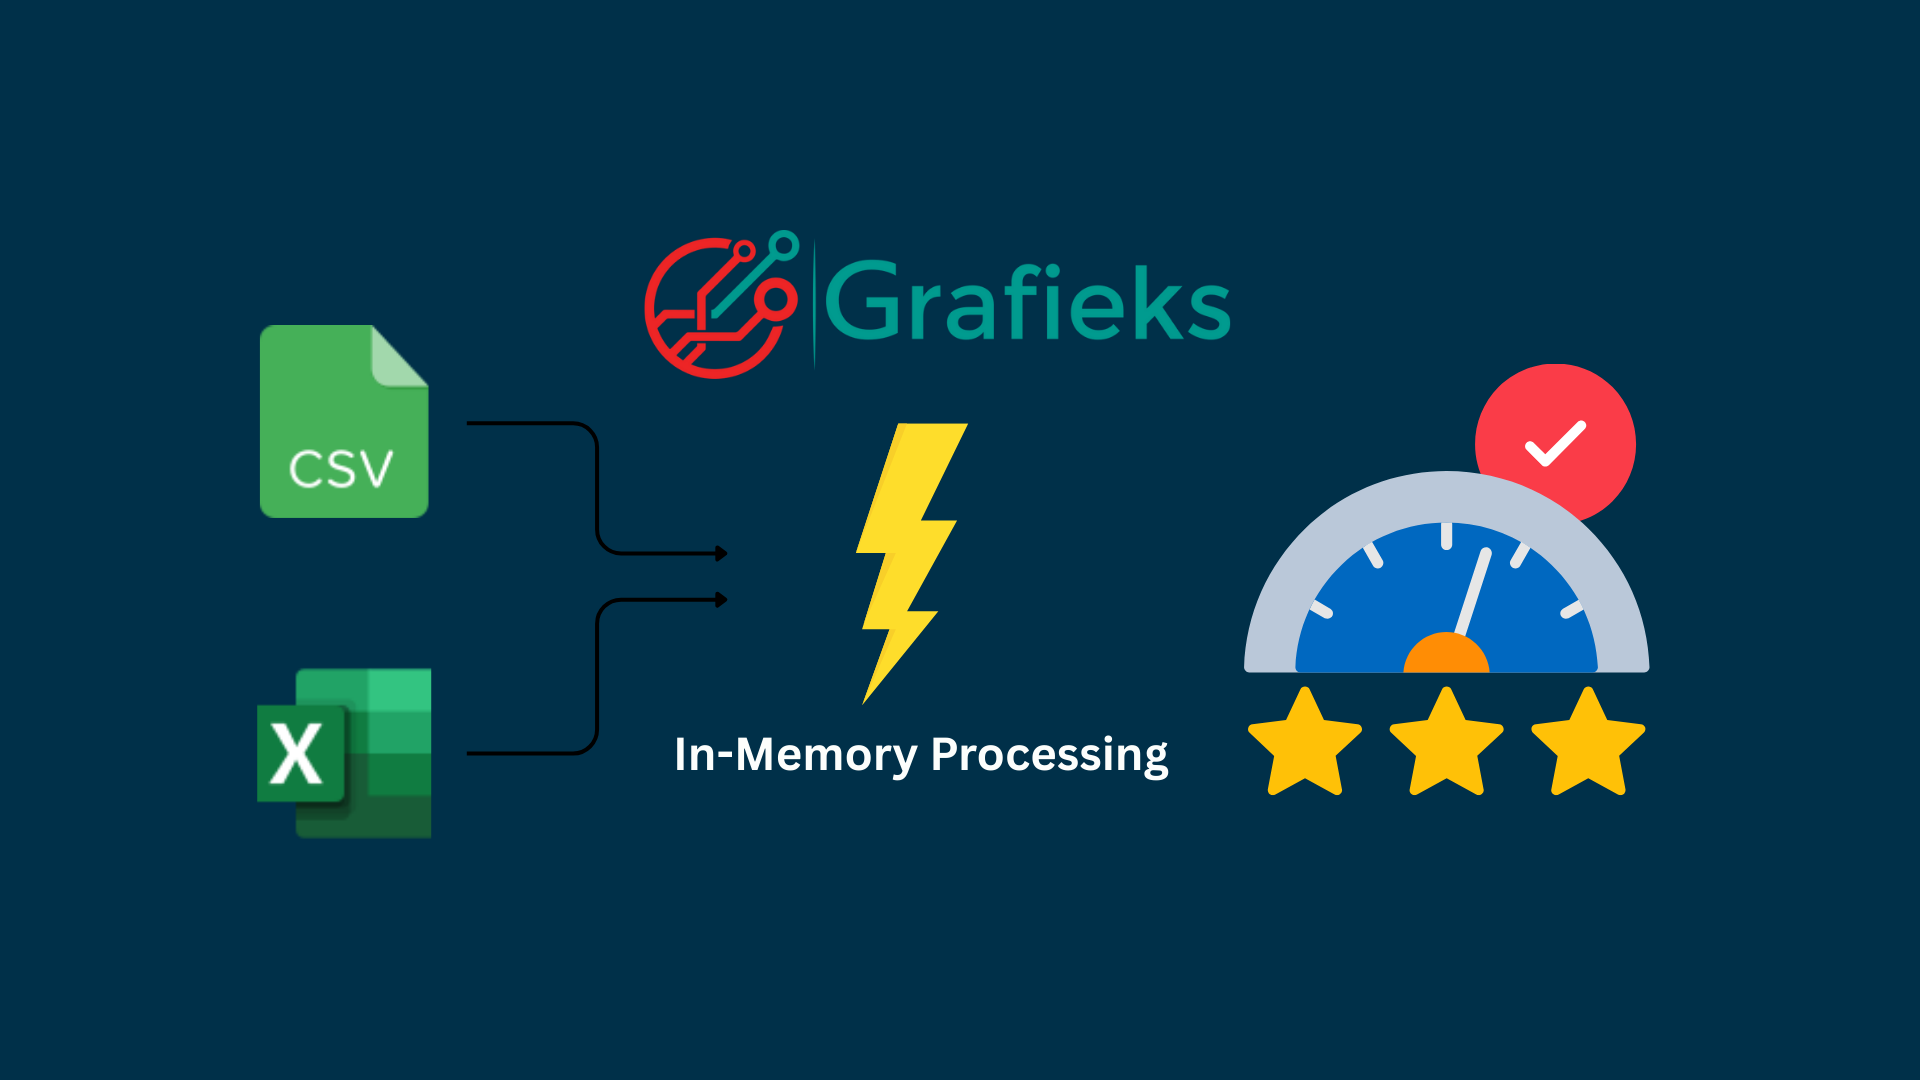
- CSV & Excel Import – Bring your datasets into Grafieks in just a few clicks.
- In-Memory Analysis – No waiting around; process data instantly with Grafieks's high-performance engine.
- Faster Insights – Explore, filter, and visualize imported data without external dependencies.
Five Powerful New Features in Grafieks
We’re excited to announce five powerful new features in Grafieks that significantly enhance how teams explore, understand, and communicate data. Here's what’s new:
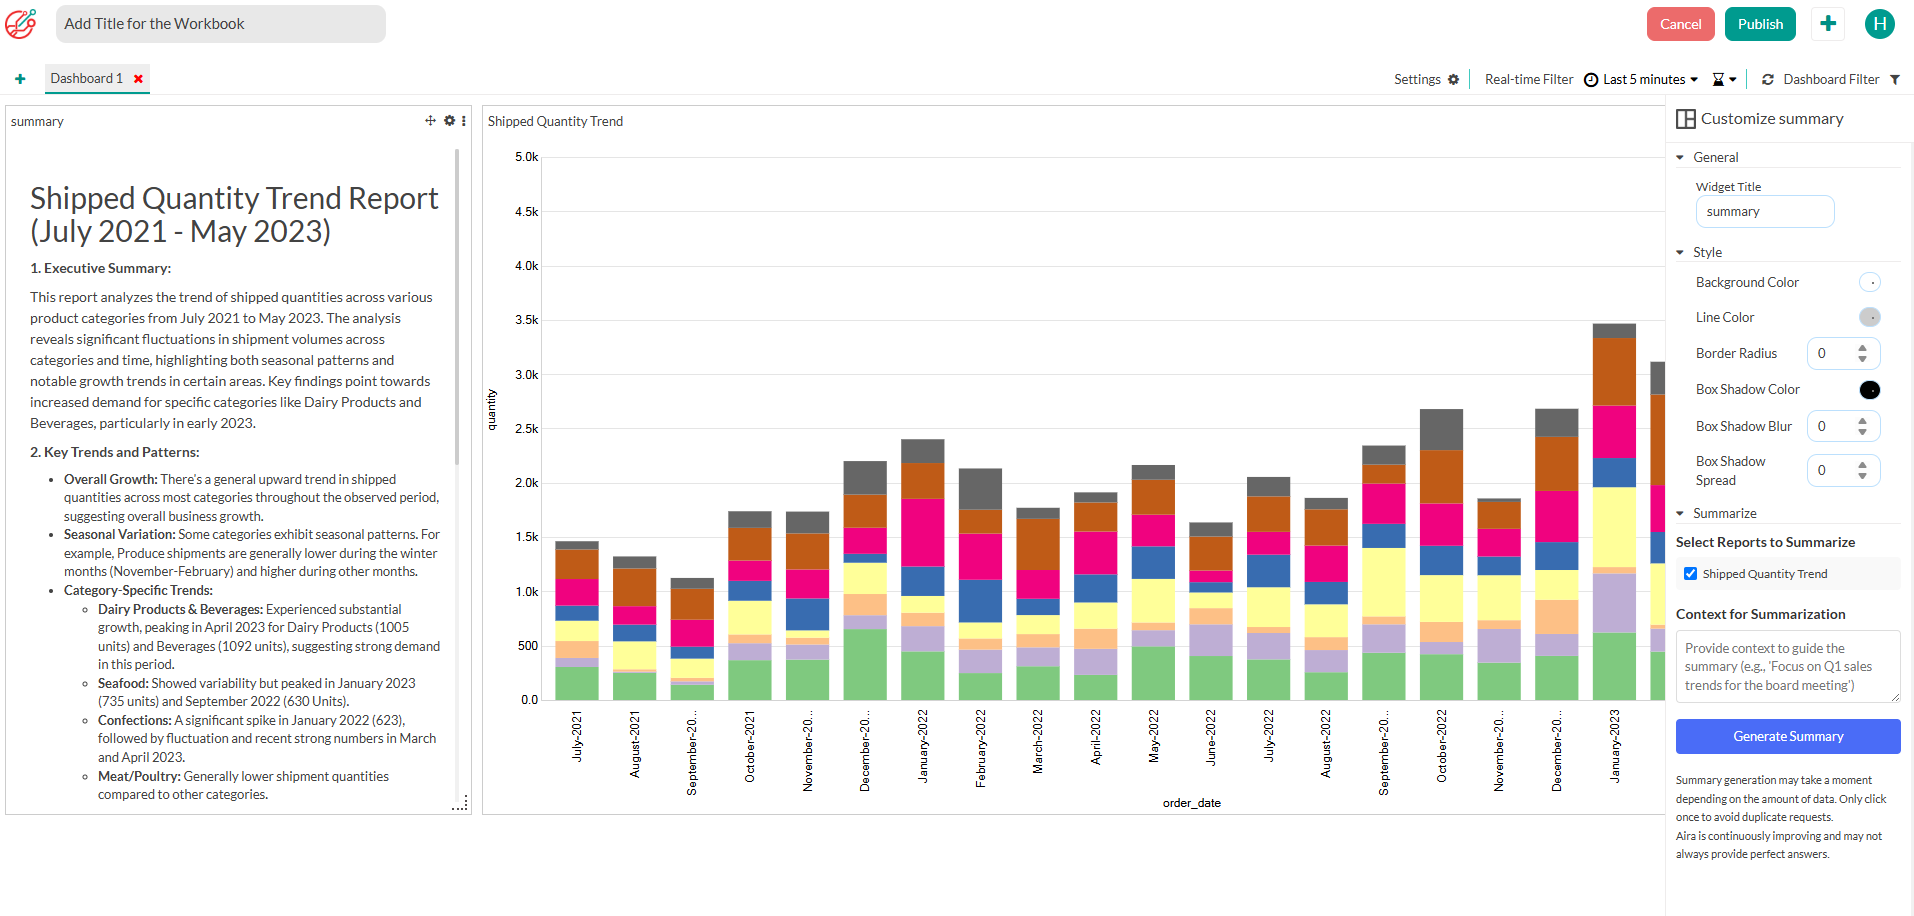
- AI-Powered Data Discovery
- Automated Report Summaries (with Zero Data Exposure)
- Custom Fields and Calculated Metrics
- Native dbt core Integration
- Unified Data Catalog
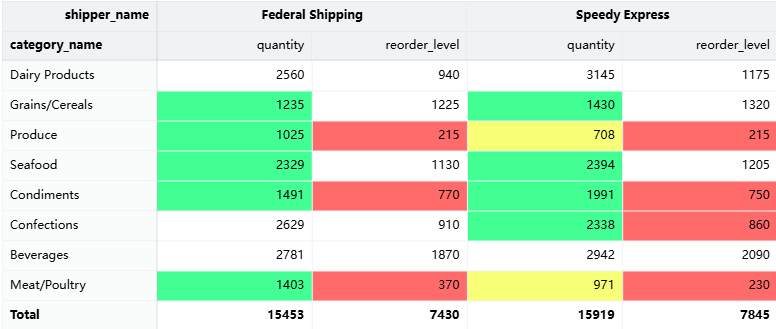
Conditional formatting in a Pivot Table
You can now apply conditional formatting in a pivot table. It will enable you to highlight specific values based on conditions, making it easier to analyze data.
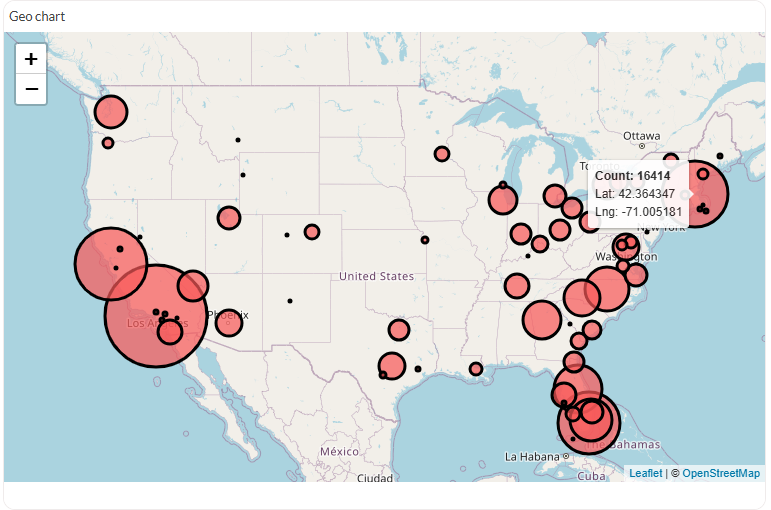
Geo bubble chart and Pinned items
You can now use geo bubble chart to display information on a map, making it easier to analyze geographic trends and distributions.
- Pinning items to your homepage
Data alert and improved pivot table performance
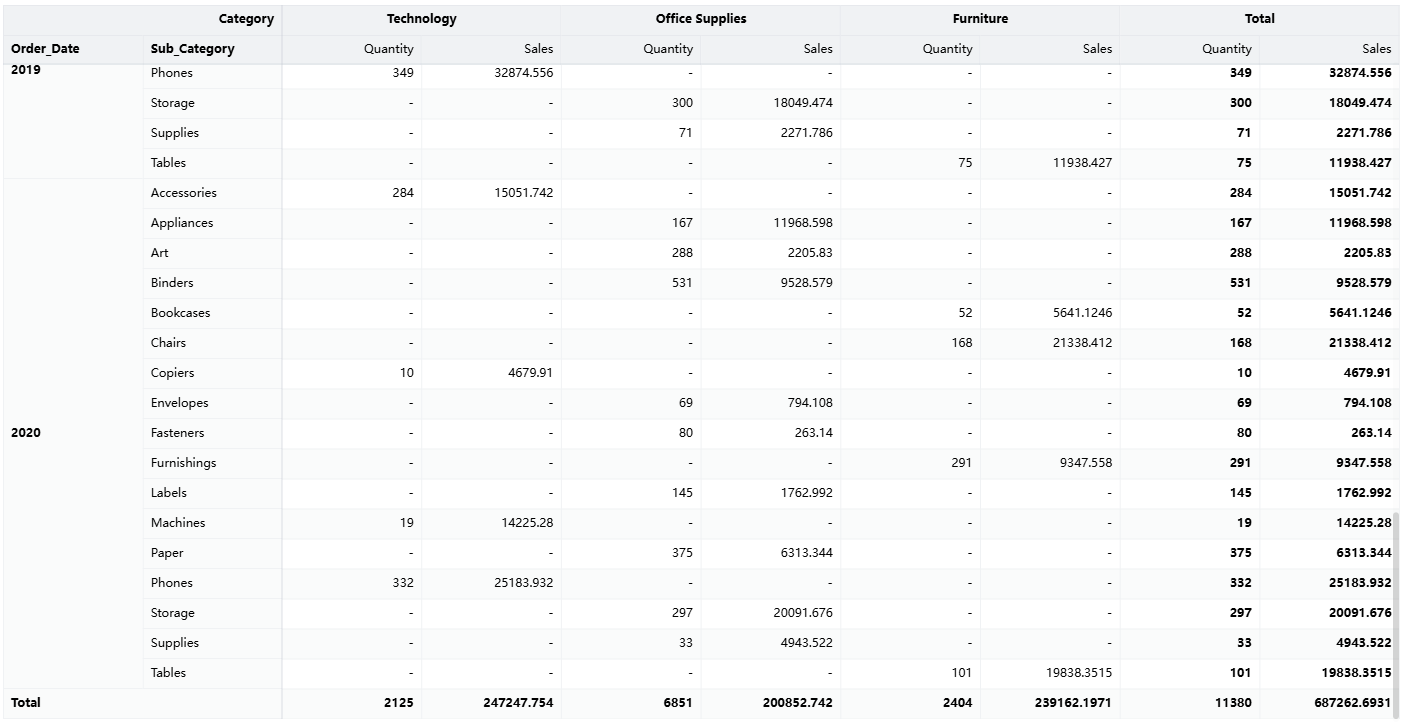
- Receive alerts based on data conditions
Ending Support for Grafieks Desktop and Fully Transitioning to Cloud
In this release we are:
- Ending Support for Grafieks Desktop :We will be discontinuing support for Grafieks Desktop. However, the source code will remain available on GitHub for those who wish to continue using or modifying it independently.
- Fully Transitioning to Cloud: We’re now offering Grafieks exclusively as a cloud-based application, providing enhanced accessibility and seamless updates. This strategic move aligns with our commitment to providing you with an enhanced and seamless user experience.
By transitioning to Grafieks Cloud, you will benefit from:- Accessibility: Access Grafieks Cloud on any device with an internet connection.
- Real-time Updates: Enjoy instant updates and improvements without the need for manual installations.
- Collaboration: Facilitate smoother collaboration among team members regardless of their location.
- Security: Enhanced security measures to safeguard your data and privacy.
Features migrated from Grafieks Desktop to Grafieks Cloud:
- Data connector
- Data modeler
- Report builder
- Dashboard builder
- Report and dashboard filter
- Table update: Key Features: Virtual Scrolling, Cross-Browser Compatibility, Data Export and more.
- Real-Time streaming data connector:This release introduces compatibility with MySQL, with support for additional streaming data sources planned in future updates.
- Real-time charts:Bar Chart, Line Chart, Area Chart, KPI
- Preview share links generate temporary links to share progress with your team
Need Help? We've Got Answers
Explore Our Most Commonly Asked Questions and Find the Information You Need.
Ready to Dive Deeper?
Everything from setup to advanced features is covered in our docs.